SPA Installation Guide
Sunday, July 19, 2026 - 2 comments

Performance Insight is the process of analyzing academic data to make proactive decisions that improve overall school performance. It involves leveraging visual data representations—such as bar charts, pie charts, and dashboards—to evaluate:
i. Student performance
ii. Class responses to subjects
iii. Teacher effectiveness
iv. Overall school academic progress
Through these insights, school administrators can identify strengths, weaknesses, and areas needing improvement. This enables strategic interventions to enhance teaching quality, student learning outcomes, and institutional performance.
Performance insight supports schools in:
1. Monitoring academic progress
2. Evaluating teaching strategies
3. Identifying struggling subjects
4. Supporting student development
5. Improving overall academic standards
SPA provides six major types of performance insight analysis, each offering a unique perspective on school performance:
i. Class-Grade Statistics
ii. Class Performance Statistics
iii. Teacher Performance Statistics
iv. Student Position Statistics
v. Class Performance Index (CPI)
vi. Performance Statistics
Definition: Statistical analysis of exam results to determine overall class academic performance.
Graphical Representation: Percentage vs Grades (A–F)
Purpose:
Identify overall class strength
Detect high failure rates
Evaluate general academic trends
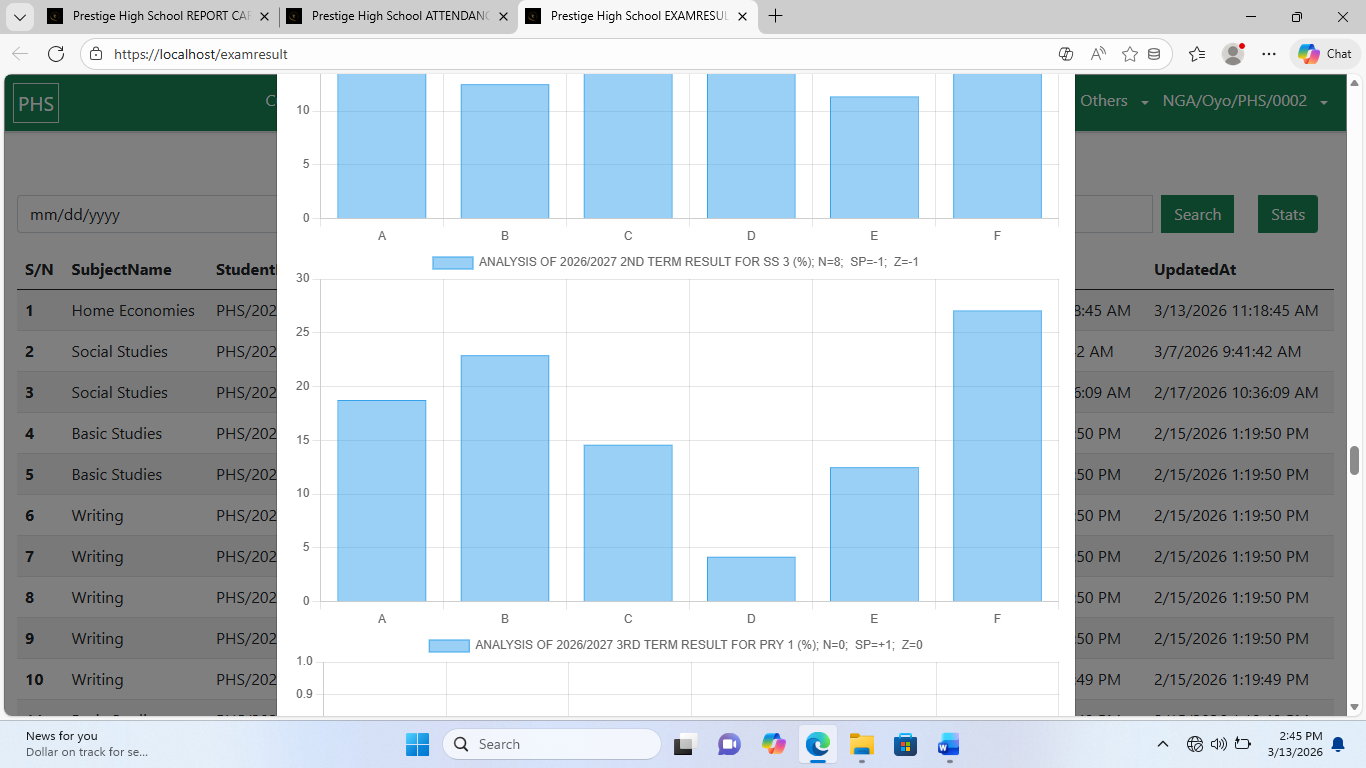
Example: SSS 3 Second Term Result
Grade Percentage
A 18.75%
B 22.92%
C 14.58%
D 4.17%
E 12.5%
F 27.08%
Analysis:
Grade F has the highest percentage → poor overall performance
Mean Score (N) = 16.67 (Standard = 80 → Poor)
Spreading Performance (SP) = −1 → inconsistent performance
Z-Test = −1 → statistically below expectations
Decision: Investigate subjects, improve teaching methods, and implement remedial lessons.
Definition: Evaluates how a class performs in each subject.
Graphical Representation: Percentage vs Subjects

Example: SSS 3 Second Term
Subject Percentage
English Language 12.53%
Mathematics 12.65%
Biology 12.11%
Physics 14.15%
Computer Science 12.61%
Further Mathematics 11.07%
Home Economics 11.57%
Social Studies 13.3%
Analysis:
Physics = highest response (14.15%)
Further Mathematics = lowest (11.07%)
Mean N = 12.50 < 80 → Poor performance
SP = −1, Z = −1 → weak performance
Decision: Enhance teaching methods, improve student engagement, and provide tutorials in weaker subjects.
Definition: Evaluates teacher effectiveness using the performance of top students to gauge maximum learning potential.

Example: SSS 3
Subject Score
English 0.8
Mathematics 1.09
Biology 0.98
Physics 1.11
Computer Science 0.67
Further Mathematics 1.28
Home Economics 1.03
Social Studies 1.16
Interpretation:
SP = −1 → inconsistent teaching outcomes
Z = −1 → below expectations
Decision: Conduct teacher training, review lesson plans, and implement new teaching strategies.
Definition: Tracks students’ academic ranking within each class.
Purpose:
Recognize top performers
Motivate students
Track academic excellence

Definition: CPI is a composite metric measuring overall class performance using four key indicators:
Academic Achievement (AA): Average exam performance
Student Growth (SG): Learning improvement over time
Graduation Rate (GR): Completion of academic level
Attendance Rate (AR): Frequency of attendance
These indicators are combined to form the Performance Index (PI), representing overall class performance.

Example: SSS 3 CPI Analysis
Indicator Value Interpretation
AA 54.19% Below benchmark
SG 0% No improvement
GR 100% Excellent
AR 5% Very low
Performance Index (PI) = 0.4 → Low overall performance
Analysis:
Graduation Rate = excellent (100%)
Academic Achievement = moderate (54.19%)
Student Growth = 0 → no measurable improvement
Attendance = 5% → very low participation
Decisions Based on CPI:
Improve attendance (monitor and incentivize participation)
Enhance academic achievement through tutorials and mentoring
Encourage student growth via continuous assessment and individualized progress tracking
Maintain graduation rate by ensuring all students meet minimum requirements
PI Interpretation Range:
0.7 – 1.0 → High performance
0.5 – 0.69 → Moderate performance
0.0 – 0.49 → Low performance
Definition: Shows top 20 students in the school, plotting scores against students.
Purpose:
Identify academic excellence
Track competitive ranking
Support recognition and motivation programs
i. Visual Observation Test: Identify trends and extreme values
ii. Average Mean Analysis (N): Compare class average to standard (80)
iii. Spreading Performance Analysis (SP): Measure consistency
iv. Hypothesis Test (Z-Test): Determine statistical significance
Interpretation of N/SP/Z Values:
Metric Meaning
N > 80 Good performance
N = 80 Moderate performance
N < 80 Poor performance
SP +1 High consistency
SP 0 Moderate consistency
SP −1 Low consistency
Z +1 Very good
Z 0 Moderate
Z −1 Very poor
Note: CPI uses AA, SG, GR, AR, and PI directly; N, SP, and Z-Test are not applied.
Overall Decision-Making Process
Performance insight enables informed decisions for school improvement:
1. Improve teaching strategies
2. Provide extra lessons and academic mentoring
3. Train and support teachers
4. Adjust curriculum delivery
5. Monitor student progress continuously
6. Support struggling students with targeted interventions
Objective
The ultimate goal of performance insight is to transform academic data into actionable strategies that improve school performance and student outcomes. For example, in SSS 3, low attendance, zero student growth, and moderate achievement resulted in a PI of 0.4, signaling the need for urgent interventions to enhance overall class performance.
Comments